✨Special Announcement: We've Joined New Relic Serverless!
Get ready to function faster with full visibility into your serverless applications—and everywhere else. Read our founders' note.


Serverless development means almost no infrastructure code to write. But there's a catch.
Breaking monolithic applications into microservices (and even nano-services) adds some new complexities for development. We built IOpipe with developers in mind by bringing visibility into serverless applications that are broken into tens or hundreds of functions, and relying heavily on third parties for things like databases, authentication, payments, and more.
IOpipe is like chrome dev tools for serverless
Bennett Rogers
Senior Engineer at Box, Co-founder of Crocodoc
Never dig through log files again.
Skip the waiting.
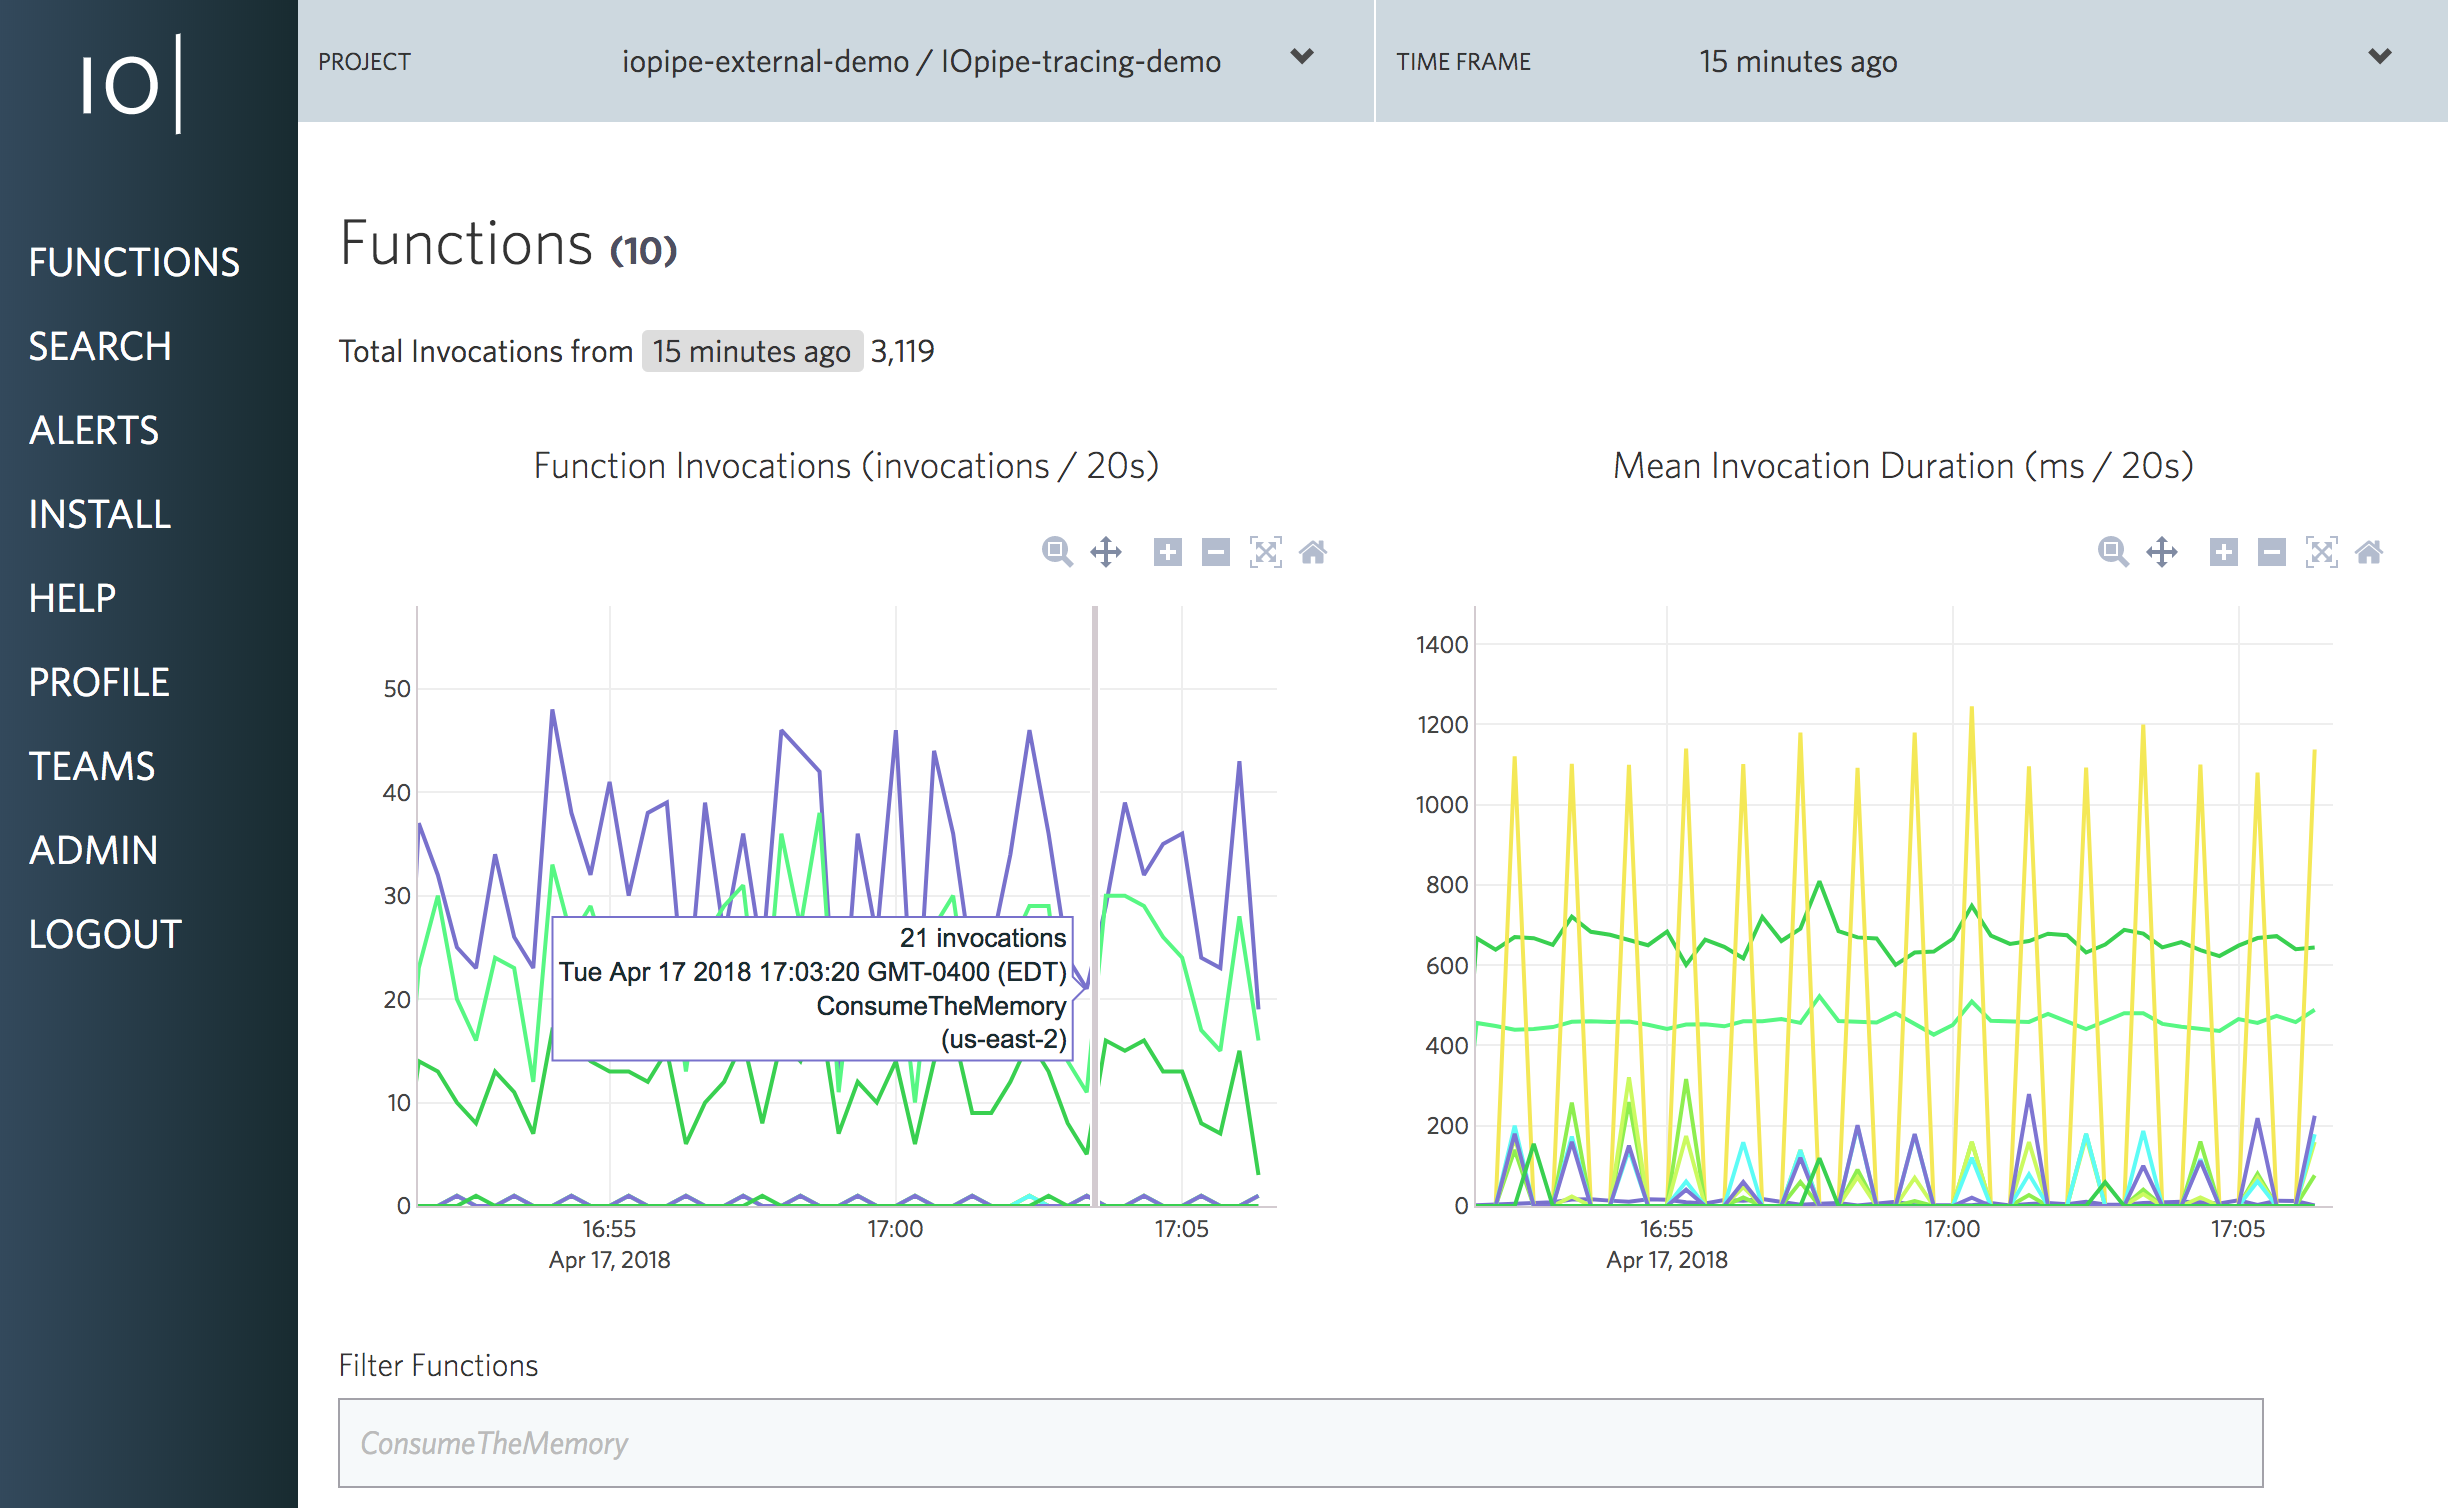
Get visibility across all your functions in less than 3 seconds. Whether running in AWS, or locally. No more waiting minutes on every code change.
Read about SAM local with IOpipe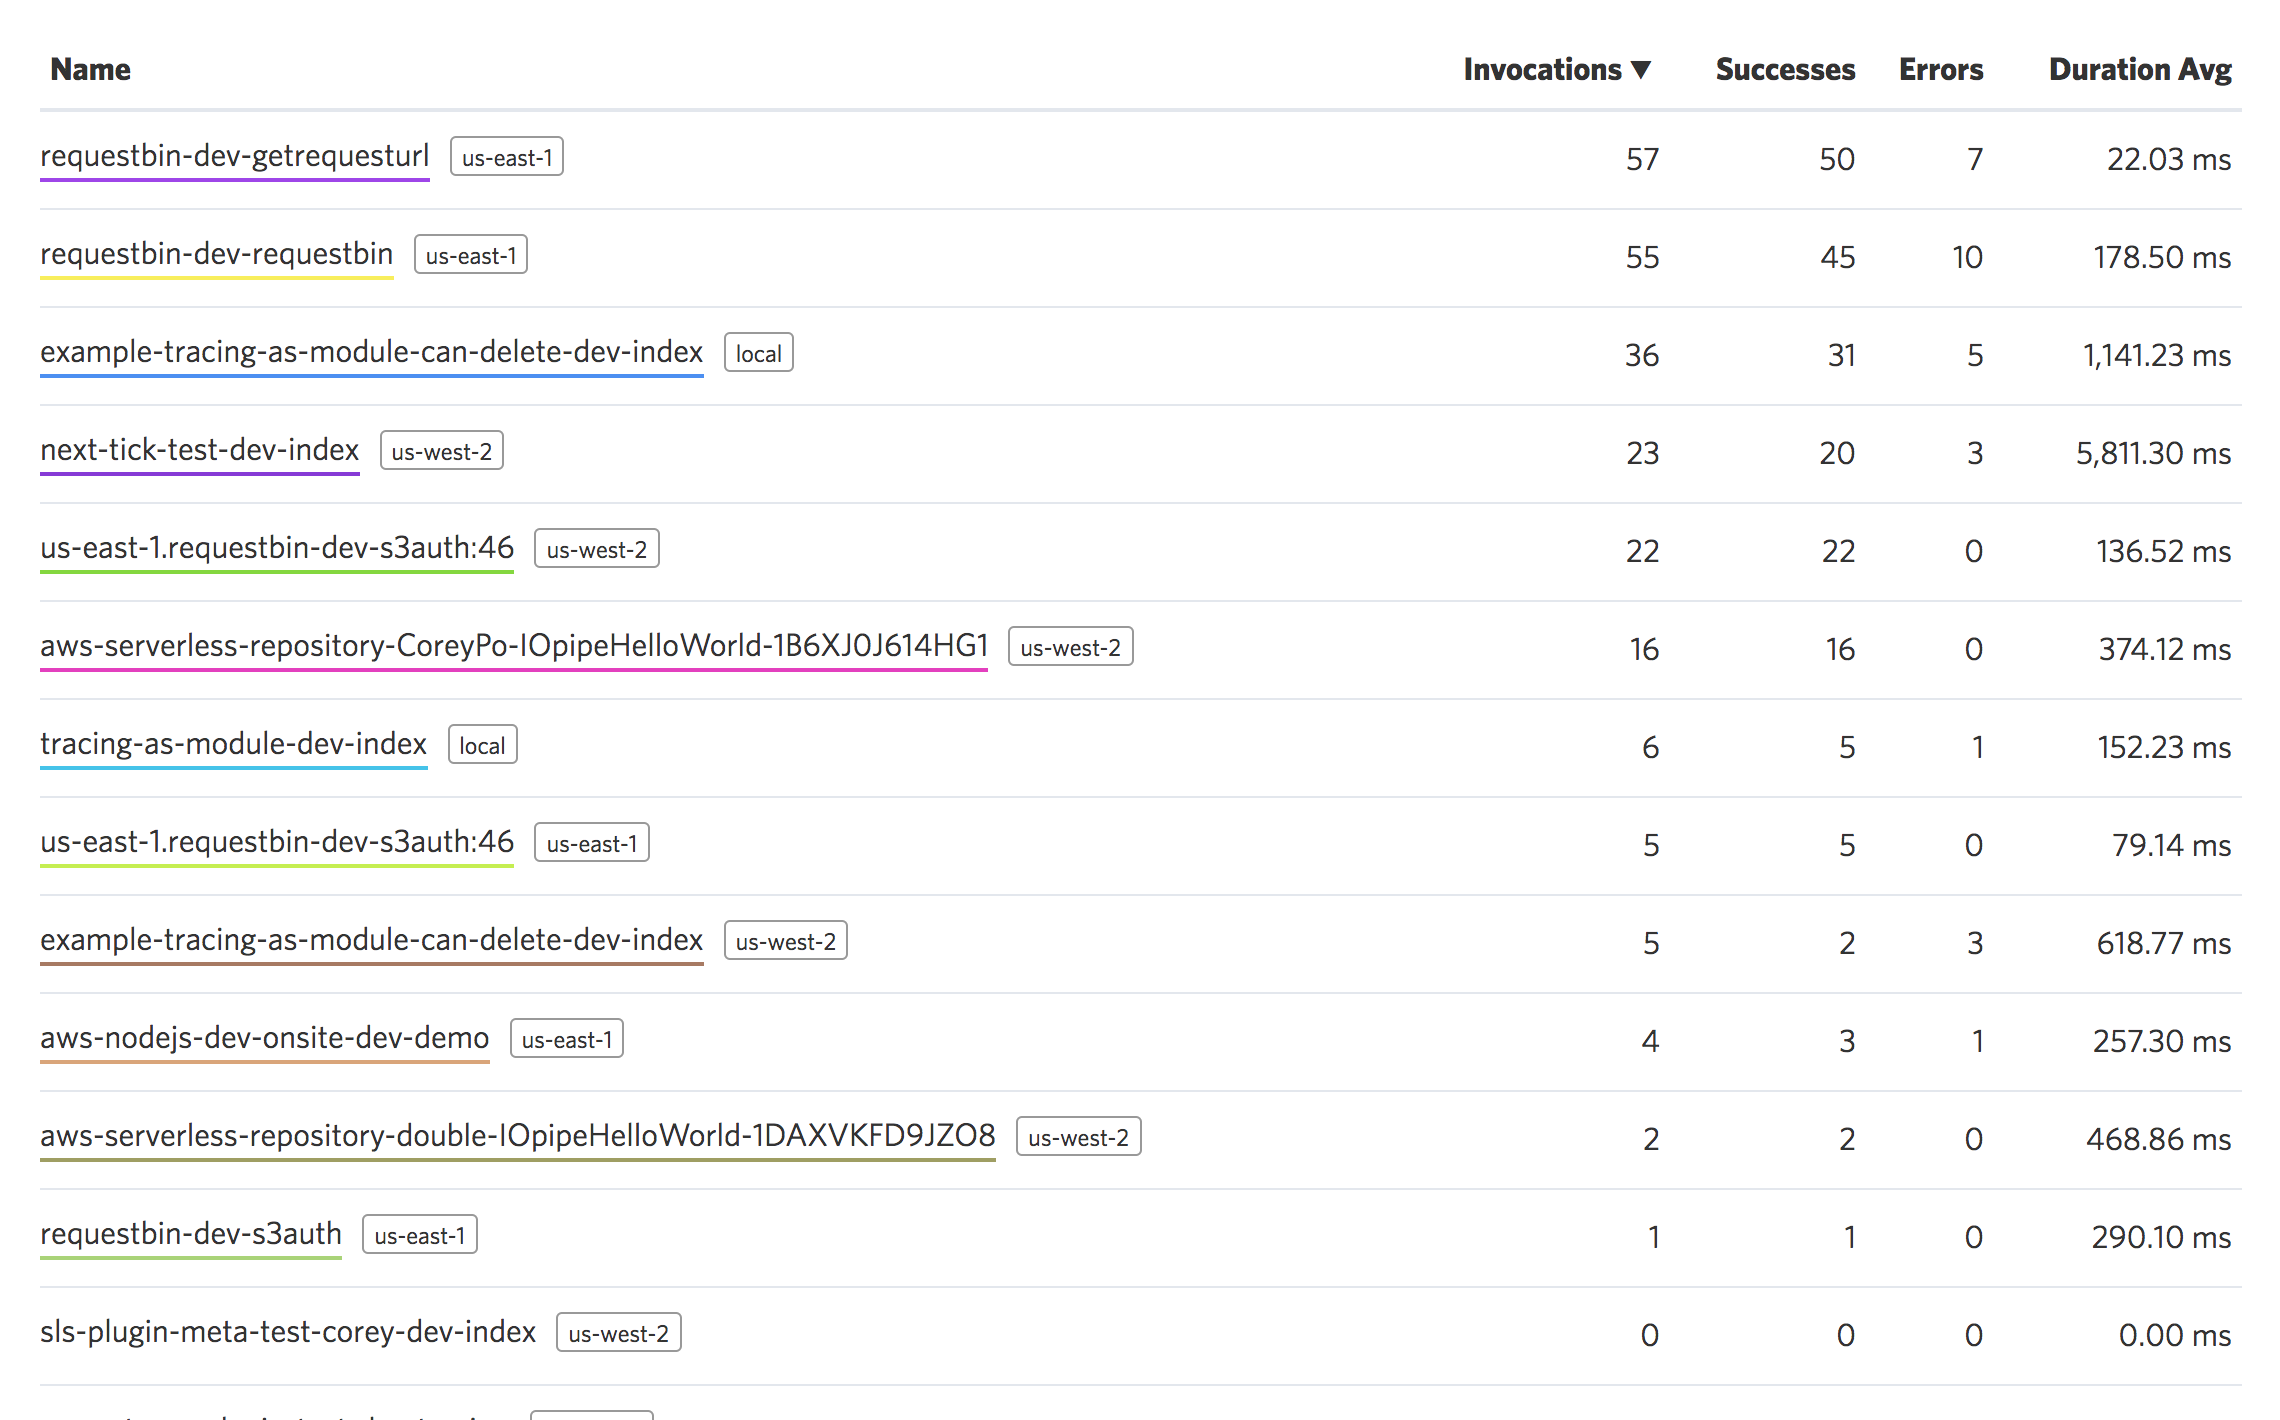
See how your code changes affect your application, across functions.
A simple code change to one function may cascade changes to other functions in your application. Functions may randomly throw errors, start timing out, or slow down dramatically. Knowing immediately when changes to functions happen can save hours or days of debugging.
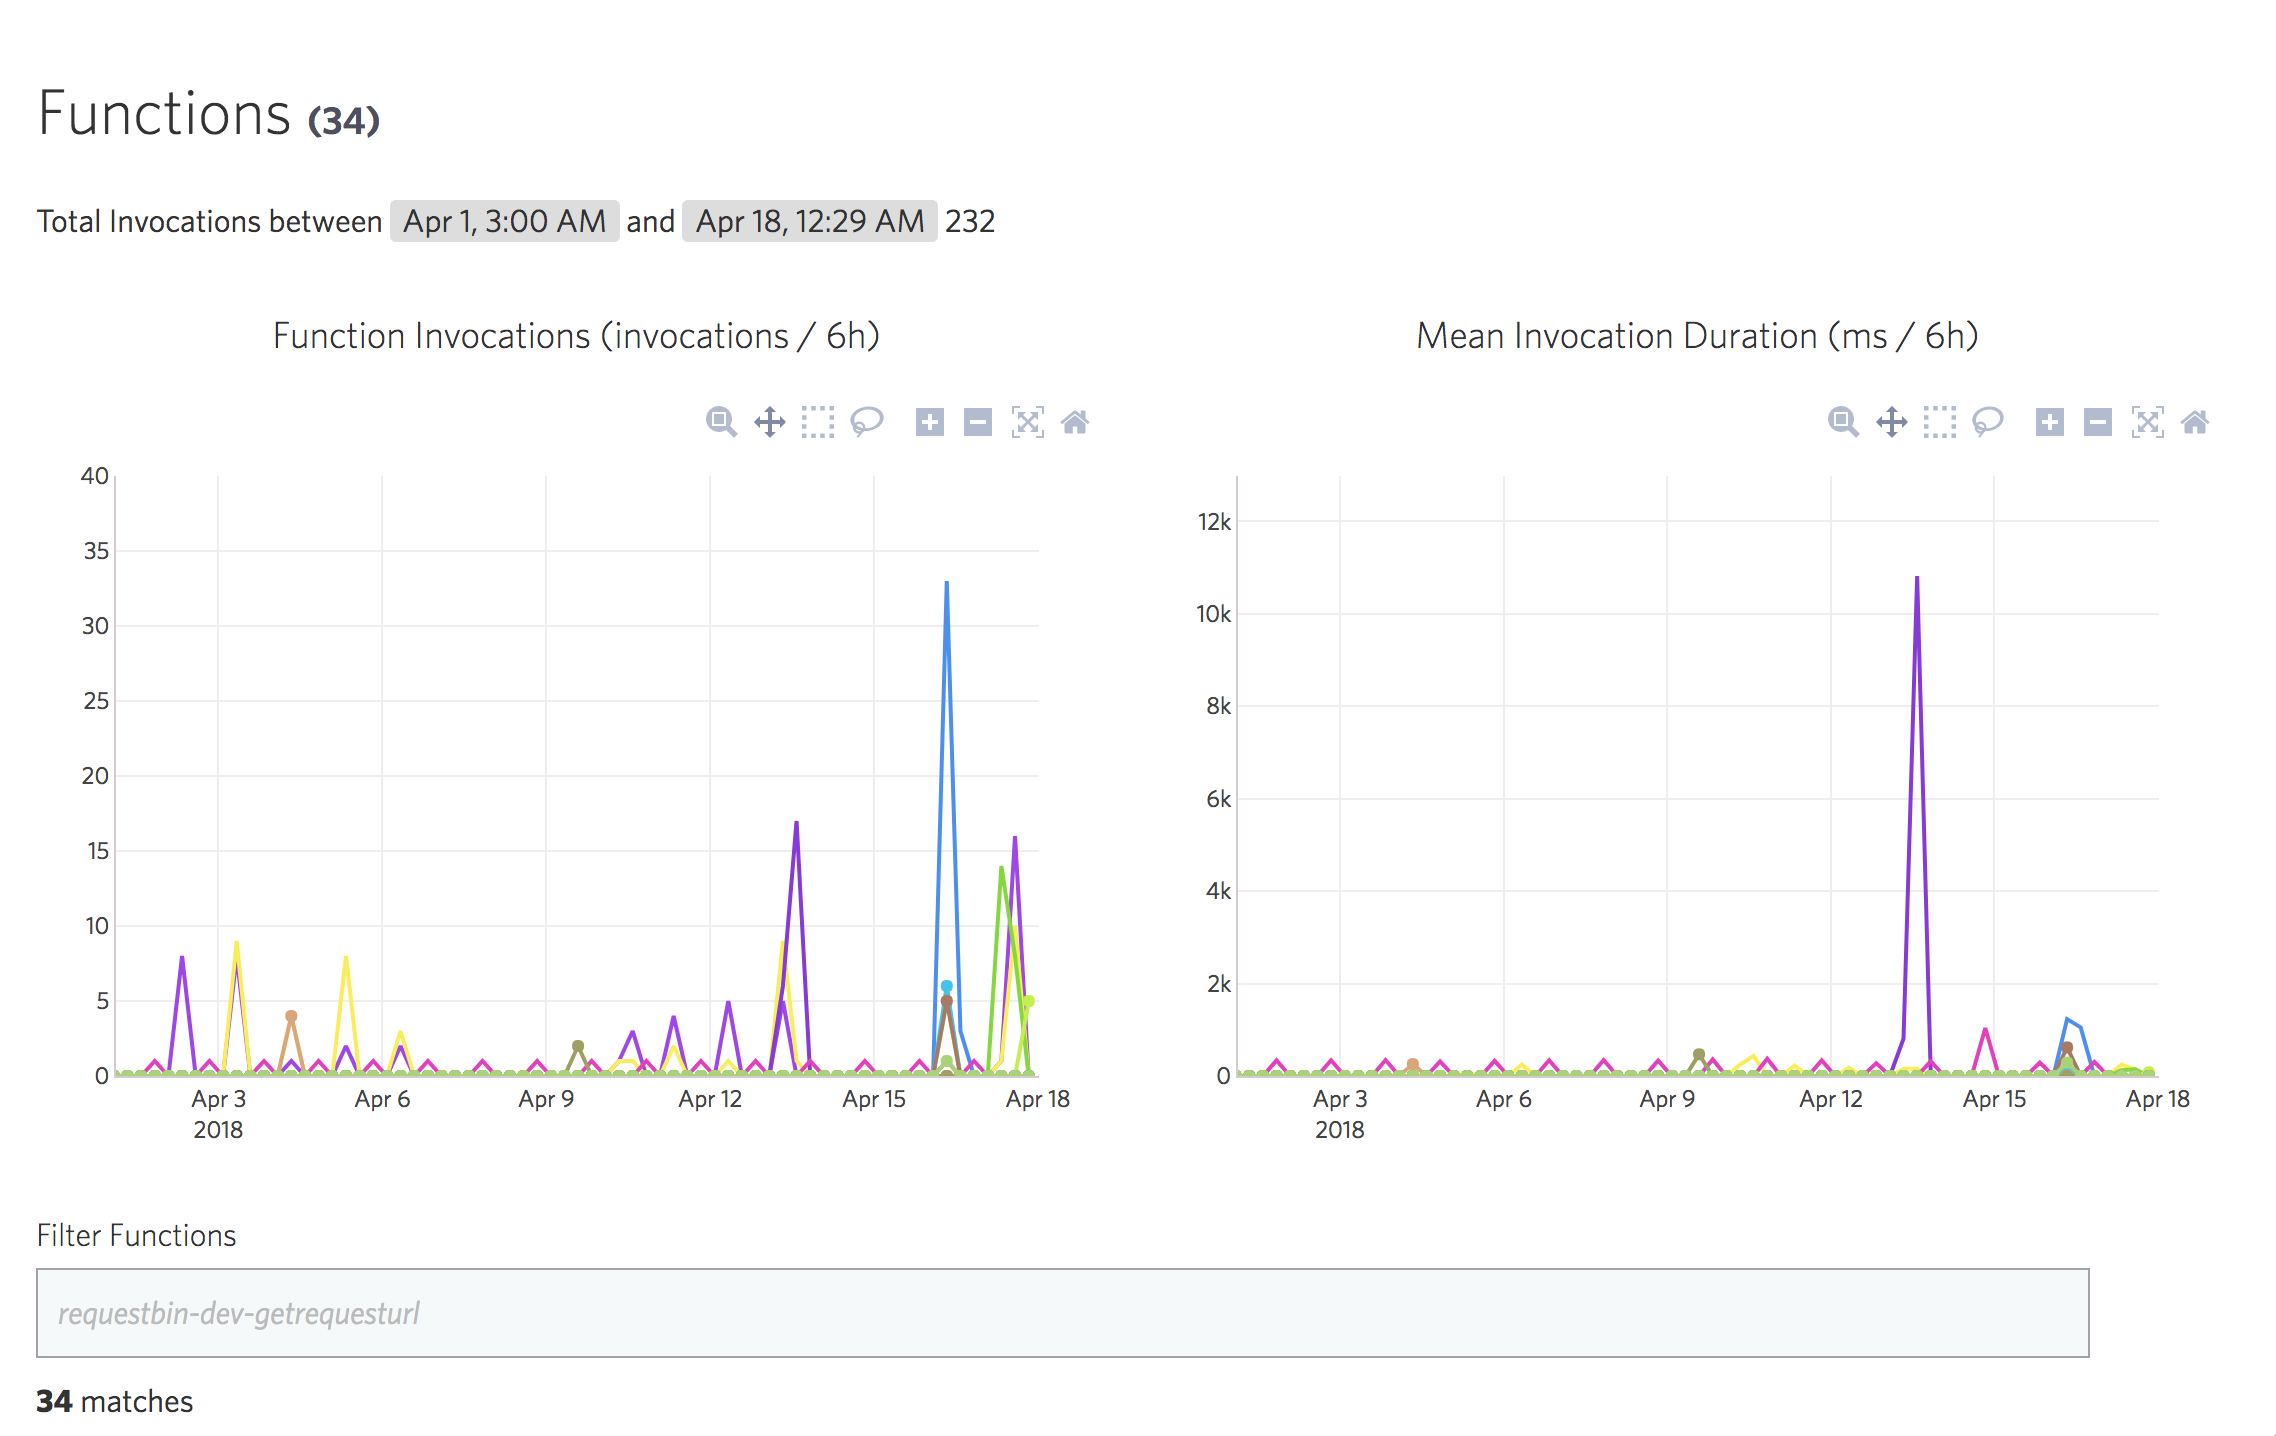
IOpipe gives a view of all functions across an application, bubbling up errors and performance metrics so you can quickly see if everything looks healthy.
IOpipe is real time, so there’s no waiting for results every time you test your code. IOpipe even works with local development tools like SAM local, or serverless-offline.
Find out what’s slowing down your functions, in seconds
Not having to worry about coding bits of infrastructure is one of the most powerful aspects of serverless development. But what happens when things go wrong? How do you know if the problem is your code, or someone else's?
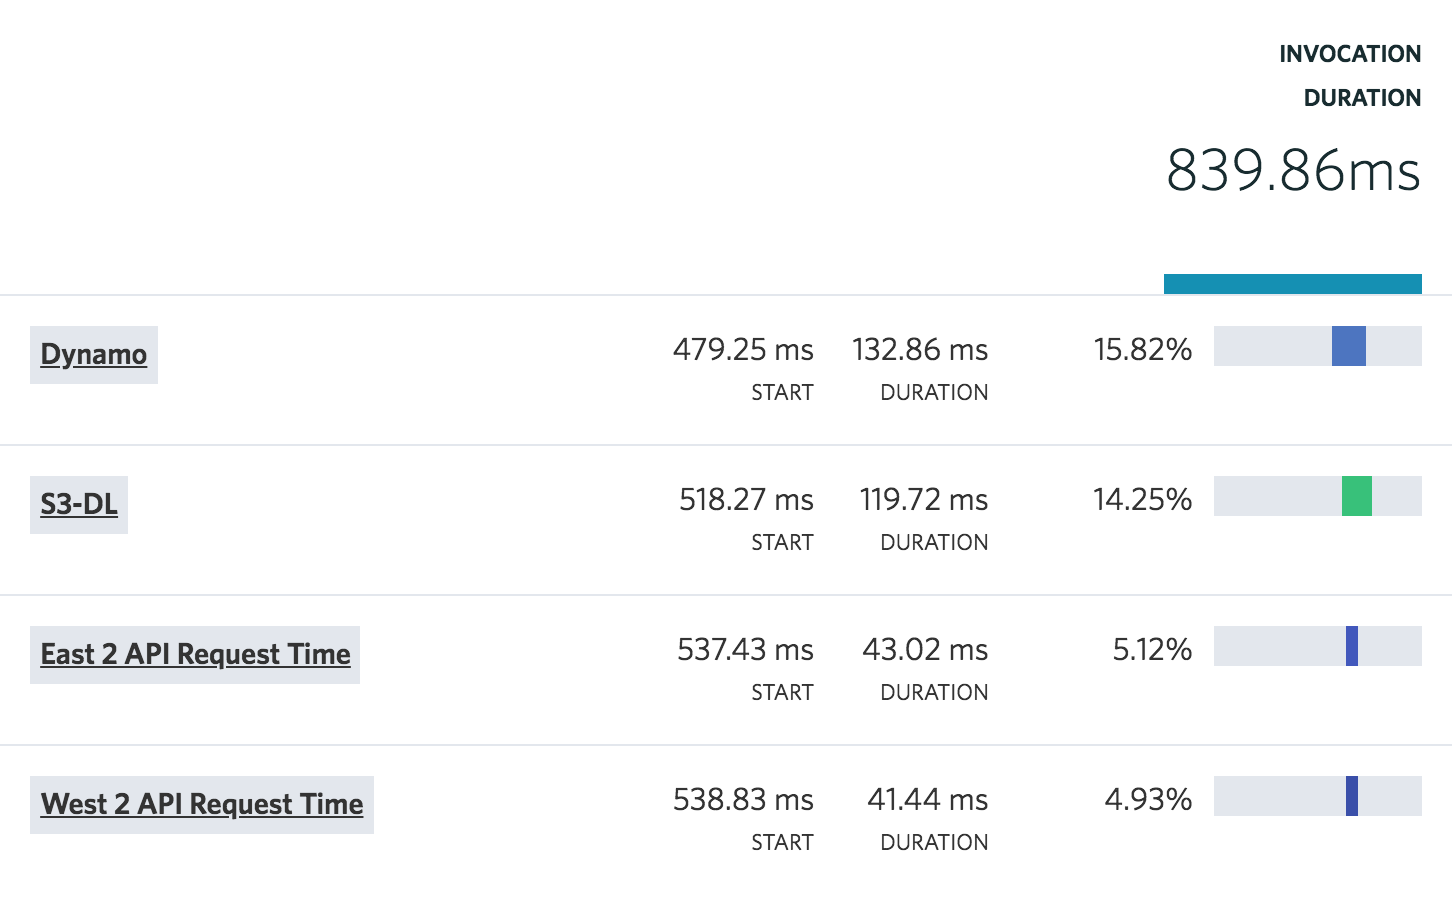
IOpipe Tracing lets you visually see exactly what’s taking time in every invocation. Whether it’s reading an object from S3, or writing a value into Dynamo, or taking a payment on Stripe, you can see exactly what’s going on. Tracing has saved developers using IOpipe days of digging through logs to track down pesky network issues while writing to a database.
See exactly what’s going on in your functions, line by line
Let’s face it, things can and will go wrong. Sometimes code doesn’t work the way you expect it to while running in AWS Lambda.
When functions aren’t working as expected, the normal course of action is to start adding log statements to figure out if and when certain lines of code are running. This can be extremely frustrating having to write a log statement, upload a new function to AWS Lambda, then dig through the logs to see what’s going on. Rinse and repeat, this can take hours.
IOpipe Profiling lets you quickly see exactly where your code is running, and for how long, line by line. No more wolf fencing, and waiting for logs to show up.