✨Special Announcement: We've Joined New Relic Serverless!
Get ready to function faster with full visibility into your serverless applications—and everywhere else. Read our founders' note.
Discover and resolve issues in your serverless apps before your users notice.
Serverless != NoOps
It's a common myth that there's no need for operations in serverless. True, things like patching operating systems when there’s a new security vulnerability are taken care of for you. With Lambda, AWS has your back on that. 💖
But, there are many other things that can and likely will go wrong in production.
Don’t fret! That's where we come in.


Debugging a serverless app
Stop staring at dashboards.
Use alerts to spot issues before your users notice
Let’s face it, you’re busy. We all are! We built IOpipe to scratch our own itch so that we could get back to writing code, not staring at dashboards all day. Alerts let you easily create powerful alerts based on the rich telemetry your functions send to IOpipe.
Notify your team in Slack when there are errors, when a function suddenly slows down, or runs less frequently than expected.
Need something more critical? Ping PagerDuty when writes to DynamoDB take longer than 10 seconds, or when a Lambda fails to read records from Kinesis.

This Lambda is running slow, now what?
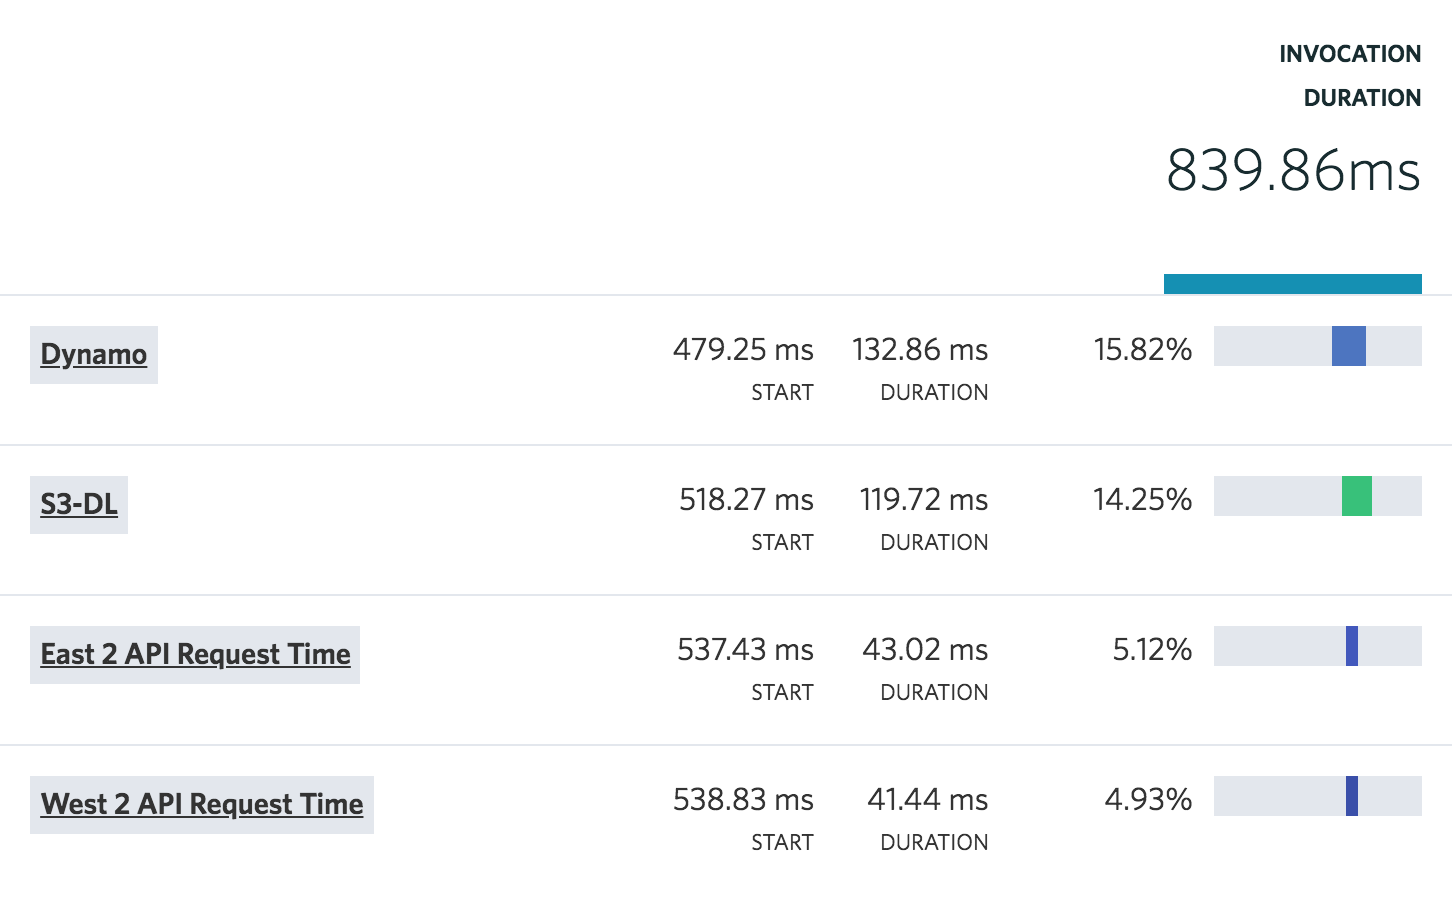
So you’ve run into some performance issues with a function. Previously you might have started digging through logs to figure out what’s happening. Fortunately, you’re a smart IOpipe user. You’ve enabled IOpipe Tracing, and you can quickly peek into the slow invocations to see exactly where things went wrong.
A call to DynamoDB is taking over 1 second, time to start optimizing the DynamoDB query. This took all of 30 seconds to figure out, without opening up a single log file.
Find the needle in the invocation stack
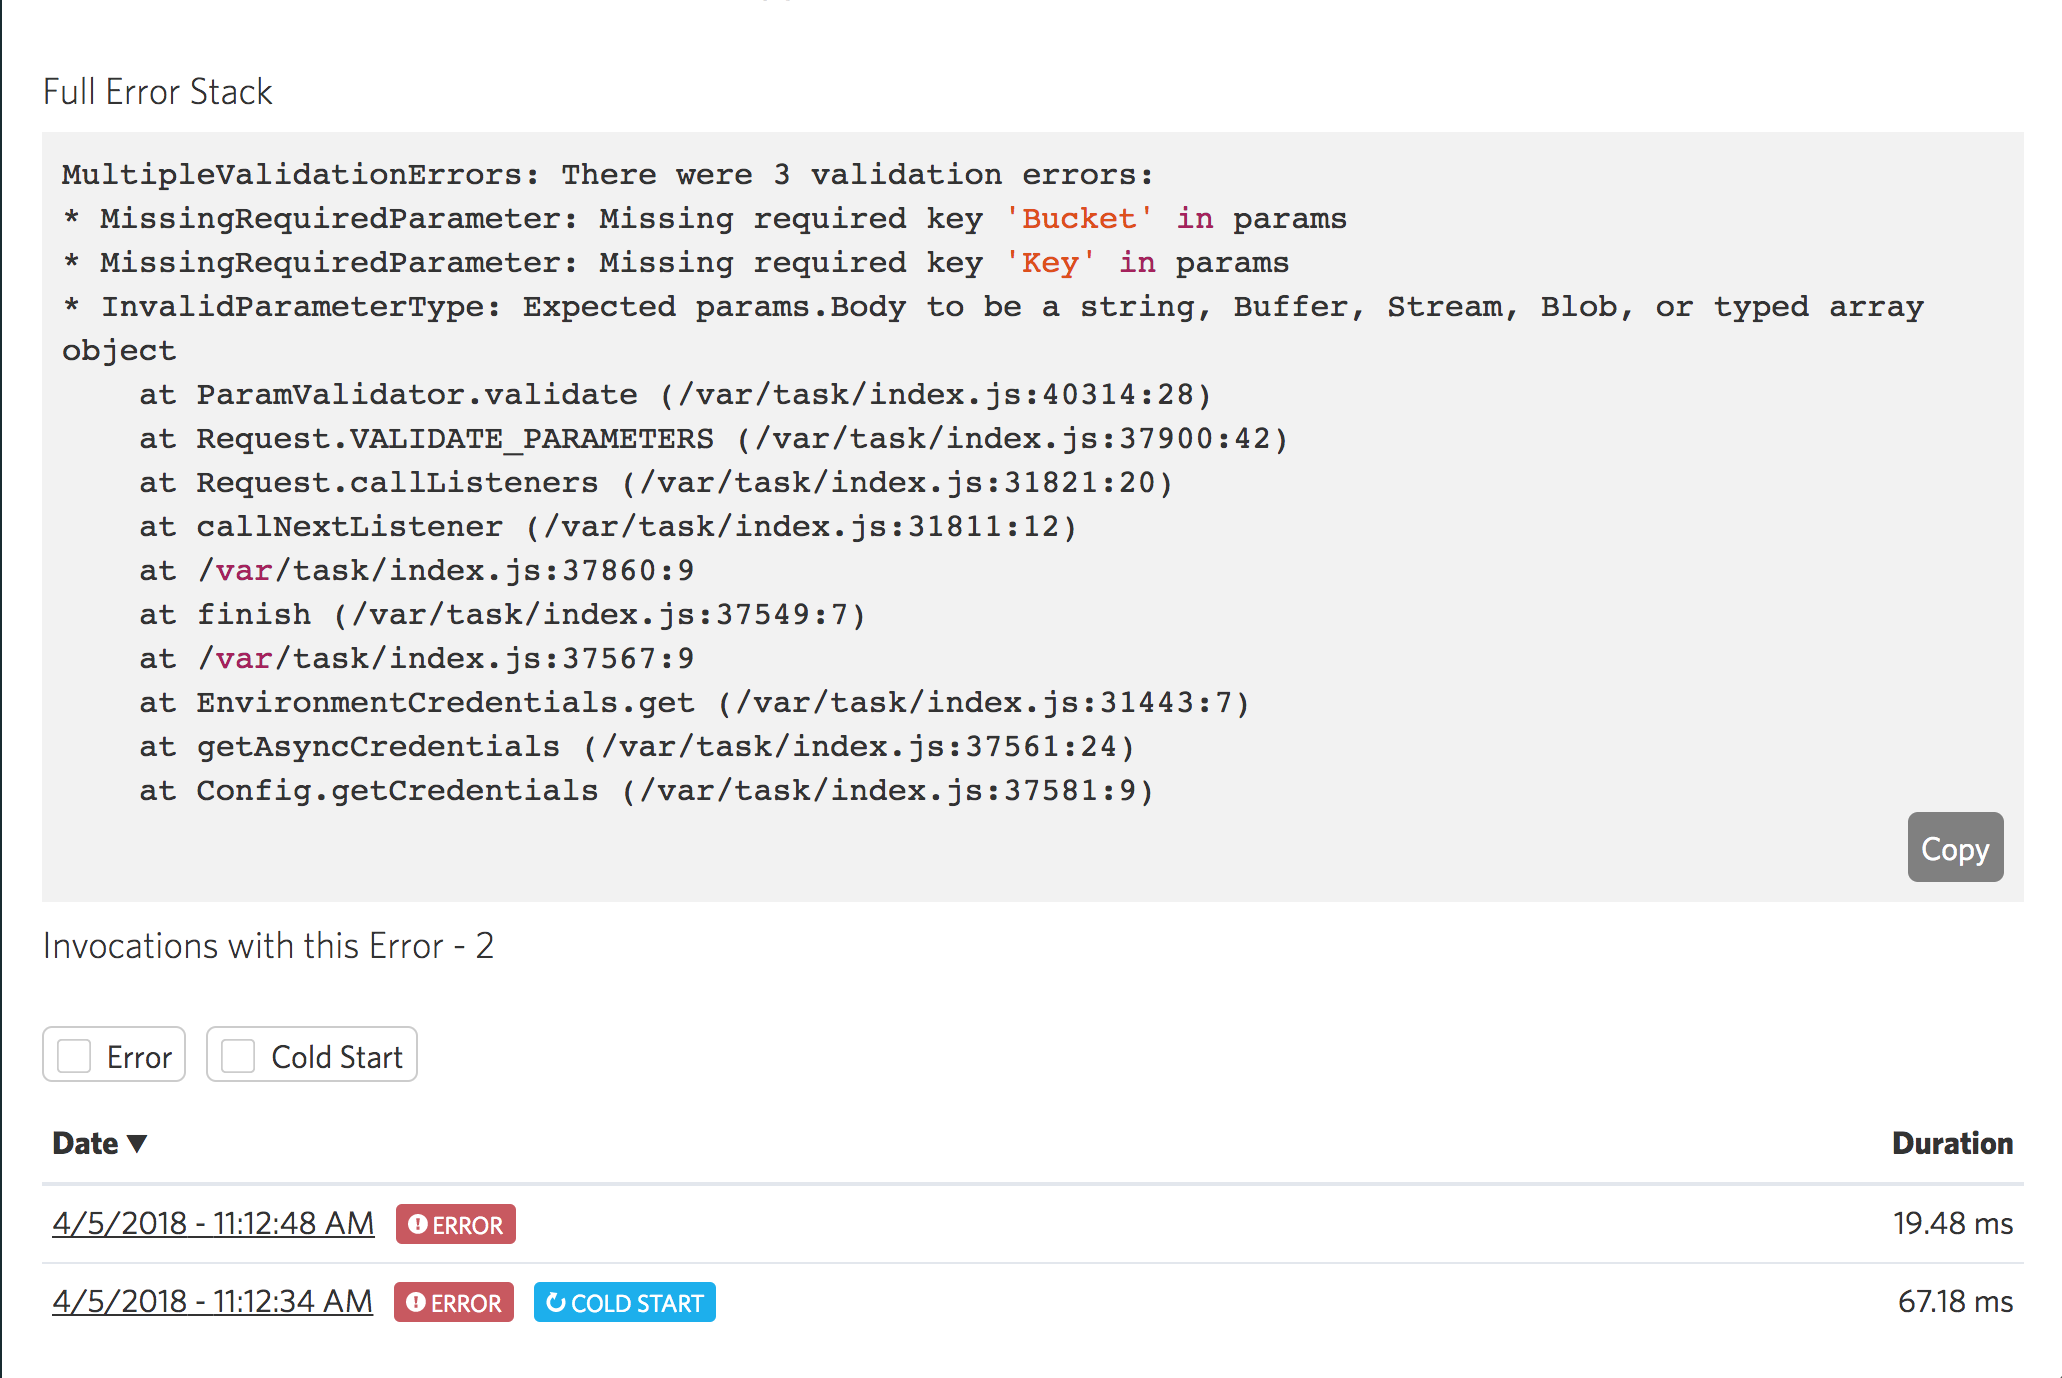
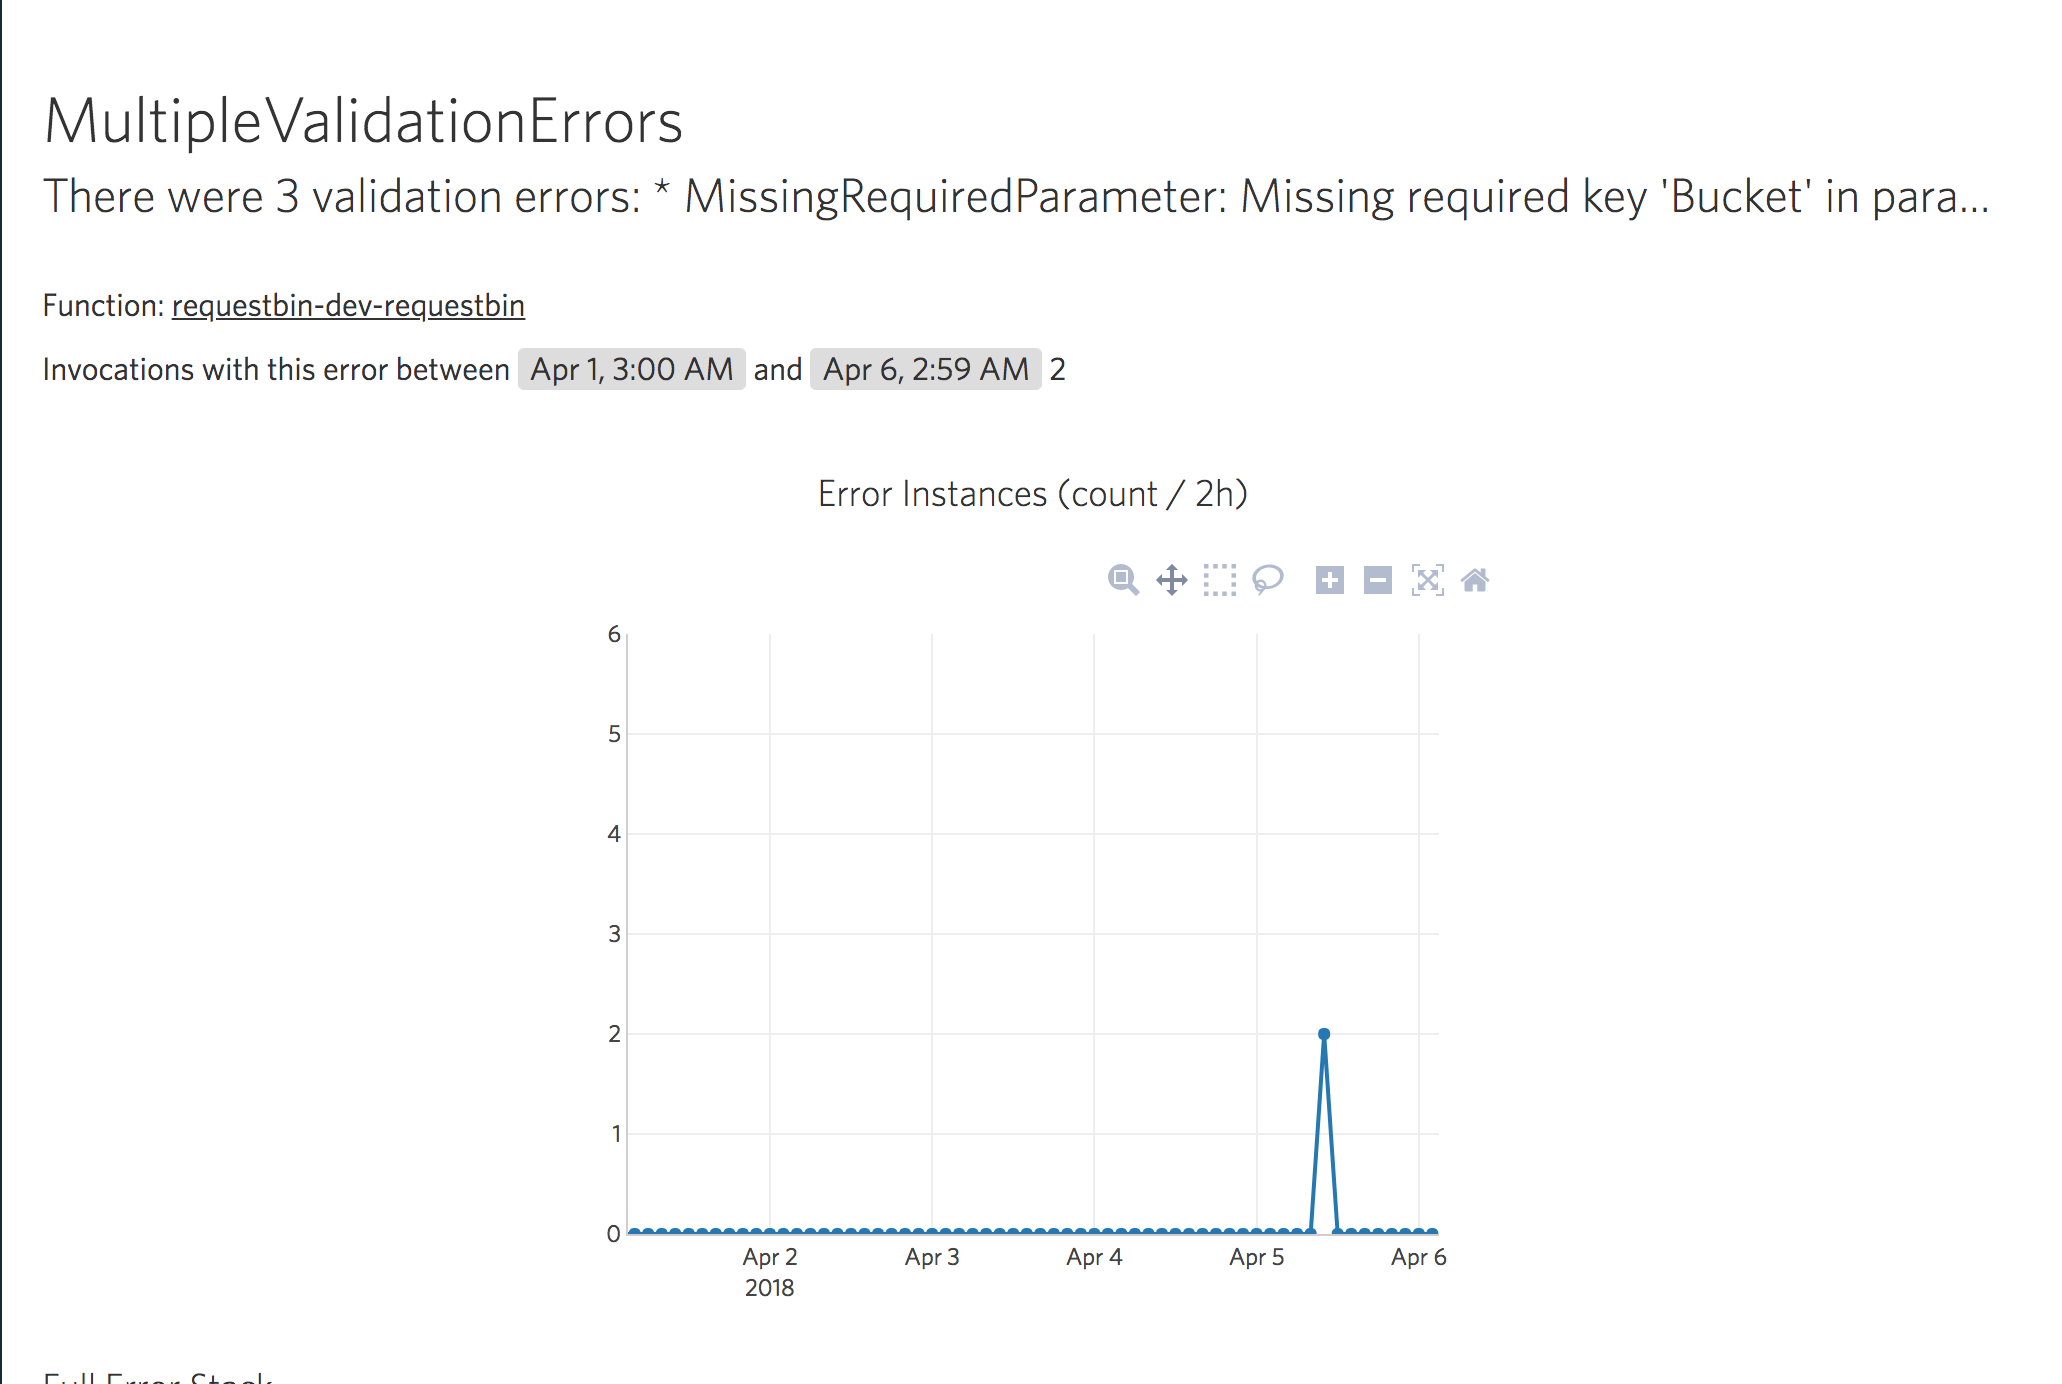
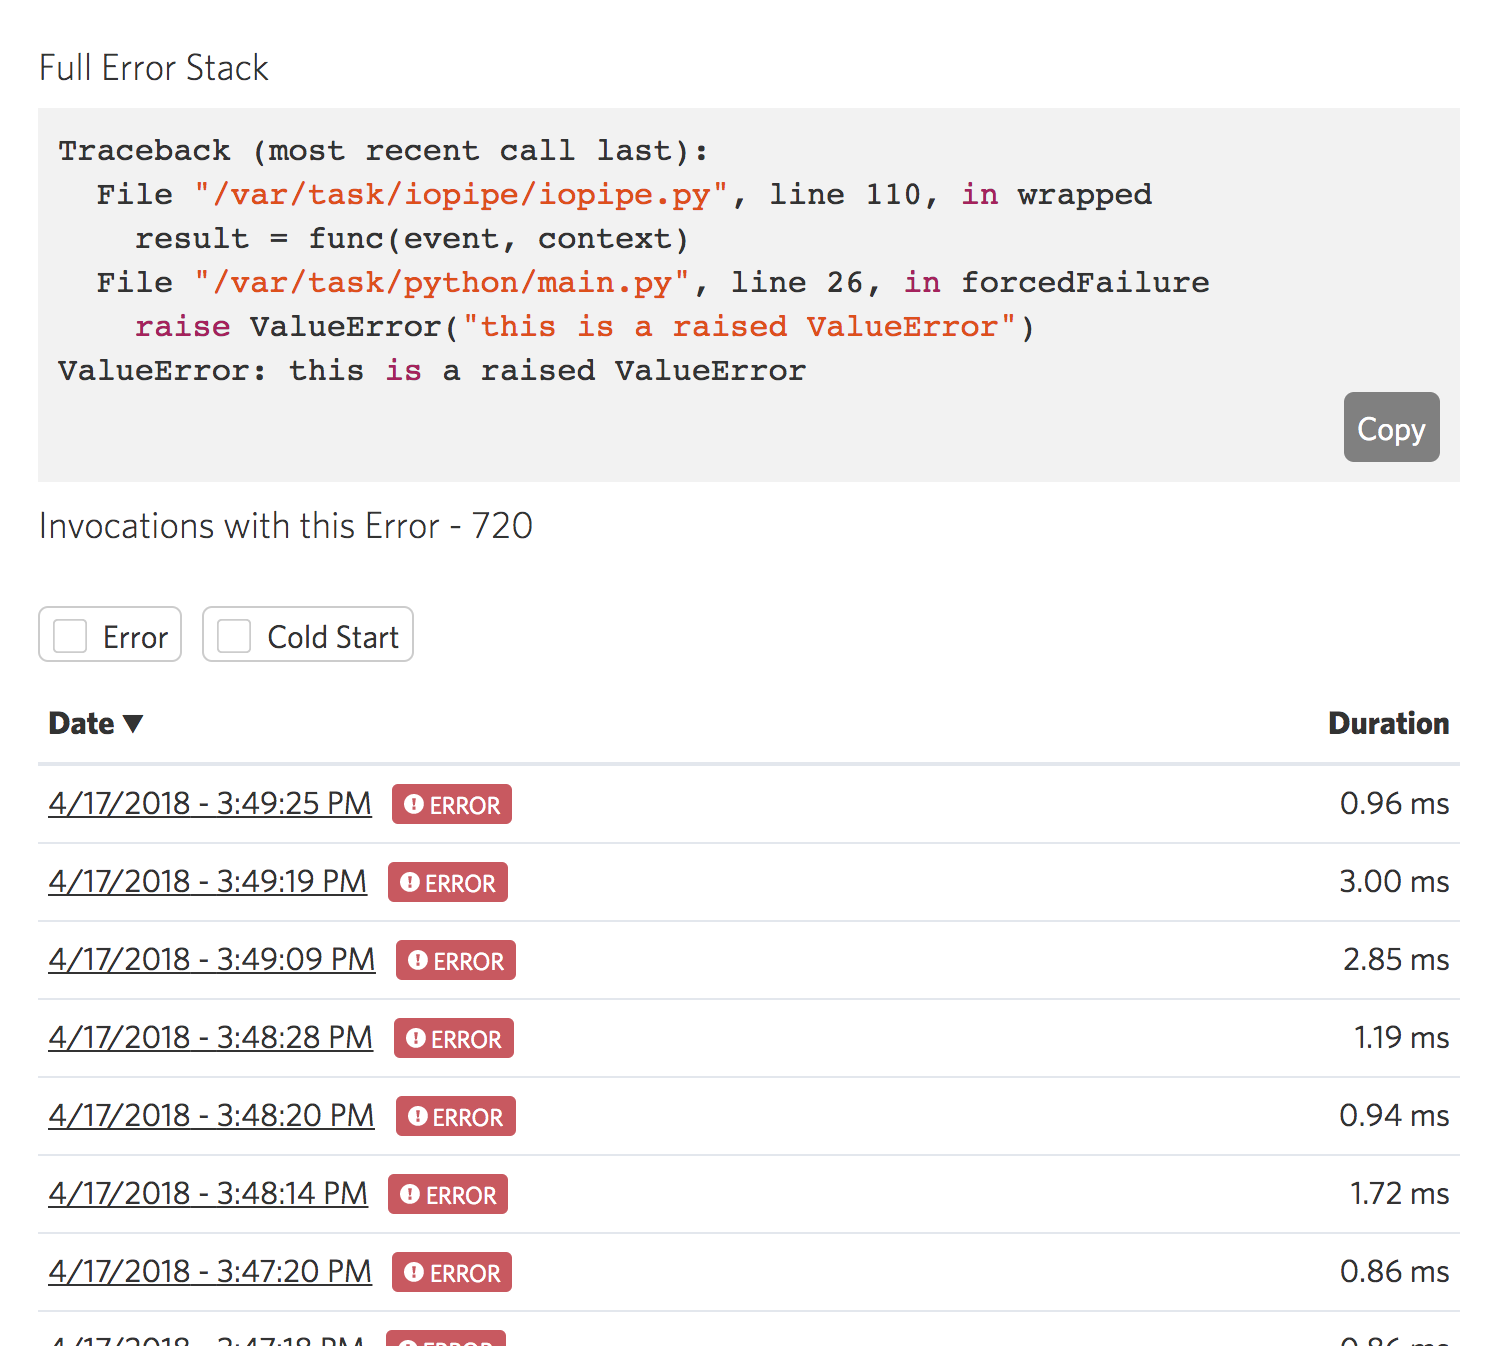
A user submits a support ticket saying that they are running into issues completing an order. Pop open IOpipe Search and let’s find the invocations in question. You, being the smart dev you are, used custom metrics to store the order number along with invocations, for easy debugging. You quickly pull up the invocations related to that order, and spot an error:
In seconds, you’ve narrowed down the problem to a single function and have the stack trace to help fix the issue.
