✨Special Announcement: We've Joined New Relic Serverless!
Get ready to function faster with full visibility into your serverless applications—and everywhere else. Read our founders' note.


Real-time
Telemetry is analyzed and displayed in less than 3 seconds.
Responsive Design
Designed from the start to work on all sized devices.
Seamless AWS Integration
Visualize and track the performance of any call
Alerts
- Multiple rules and hooks per alert
- Metrics, Errors, Custom Metrics, and Tracing
- Slack, PagerDuty, Email, Webhooks, Lambda
- Global Alerts on all and future functions. “Alert me in Slack whenever there’s an error on any function for this application”
Powerful alerts give you peace of mind that your serverless applications are running smoothly. With IOpipe, you gain several ways to customize your alerts to make sure you’re reaching the people who need to see, in the way that fits your workflow.
Metrics
- Realtime high-resolution metrics. Down to the exact invocation.
- Percentiles to spot outliers quickly
Traditional metrics services rely on aggregate data with resolutions in the minutes. This low-resolution view may be fine for traditional applications, but in an event-driven application that may fire off millions of events per minute, aggregates are simply not enough.
IOpipe has been designed to ingest every event, and visualize it in real time. This high-resolution view allows you to find the exact events in question and quickly get to the bottom of what’s going on in your serverless application.
Error Aggregation
- Realtime
- Timeouts
- Stacktraces
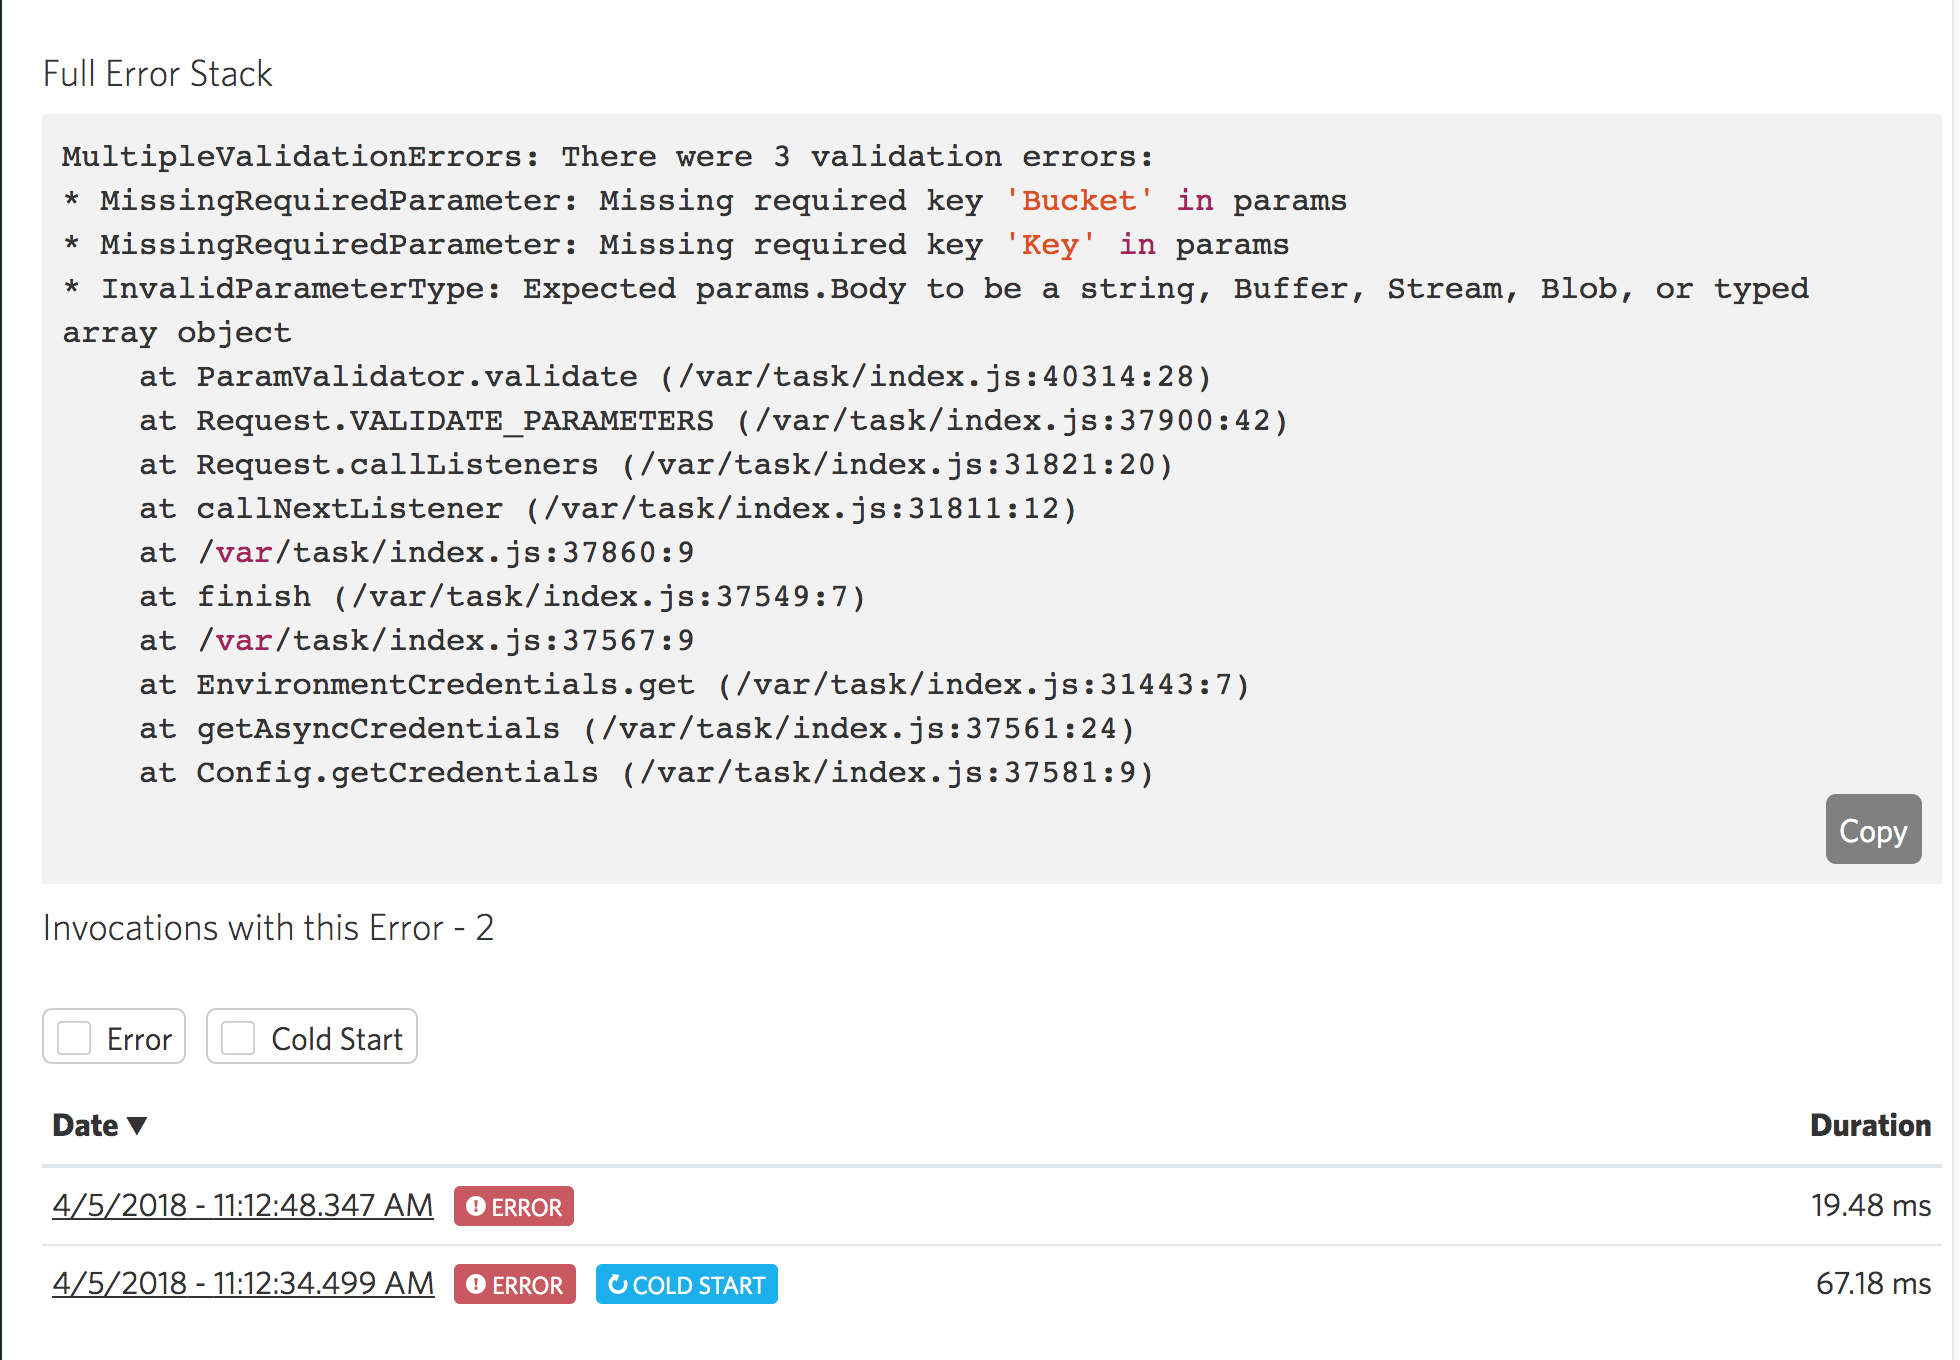
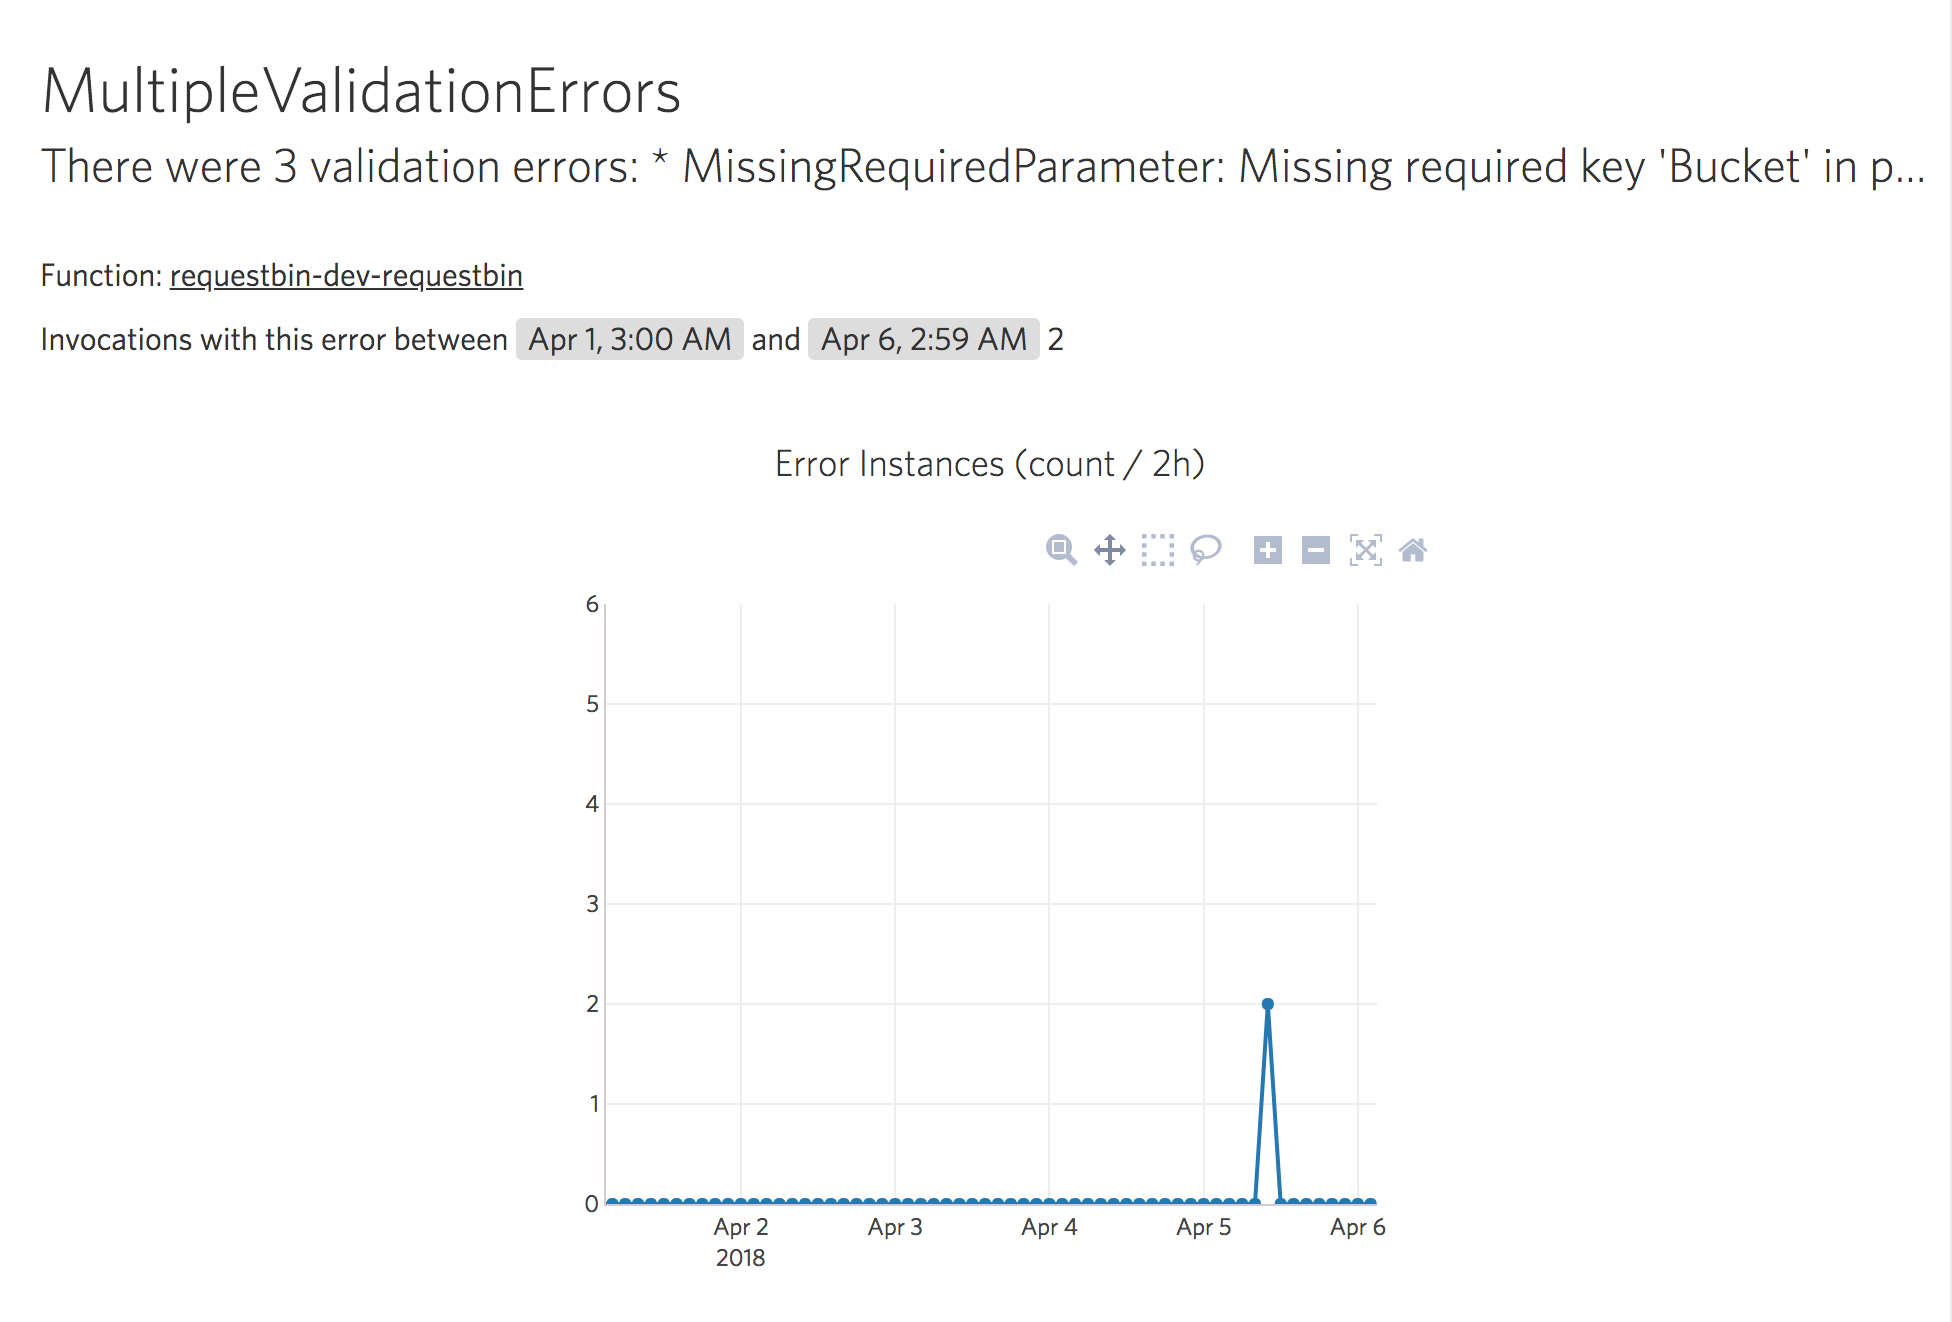
Quickly bubble up errors across functions and see every invocation that was responsible over time with full stack traces, metrics, and logs.
Receive alerts via Slack or email whenever there are errors, so you know right away if something is amiss.
Profiling
- CPU profiling for node.js functions
- See exactly what’s going on inside your function executions
Profiling lets you look inside the execution of your function, allowing you to prove your assumptions about your design decisions. You can even use this to see performance changes over iterations-- allowing you to fine-tune your functions for optimal execution time.
Also, debug faster by seeing exactly what’s happening in a function invocation without having to spend time writing log statements, uploading, and executing over and over again.
Tracing
- Track and measure performance of any call made in your functions.
- Get alerted when performance of a call degrades.
- Quickly spot which call is slowing down a function invocation.
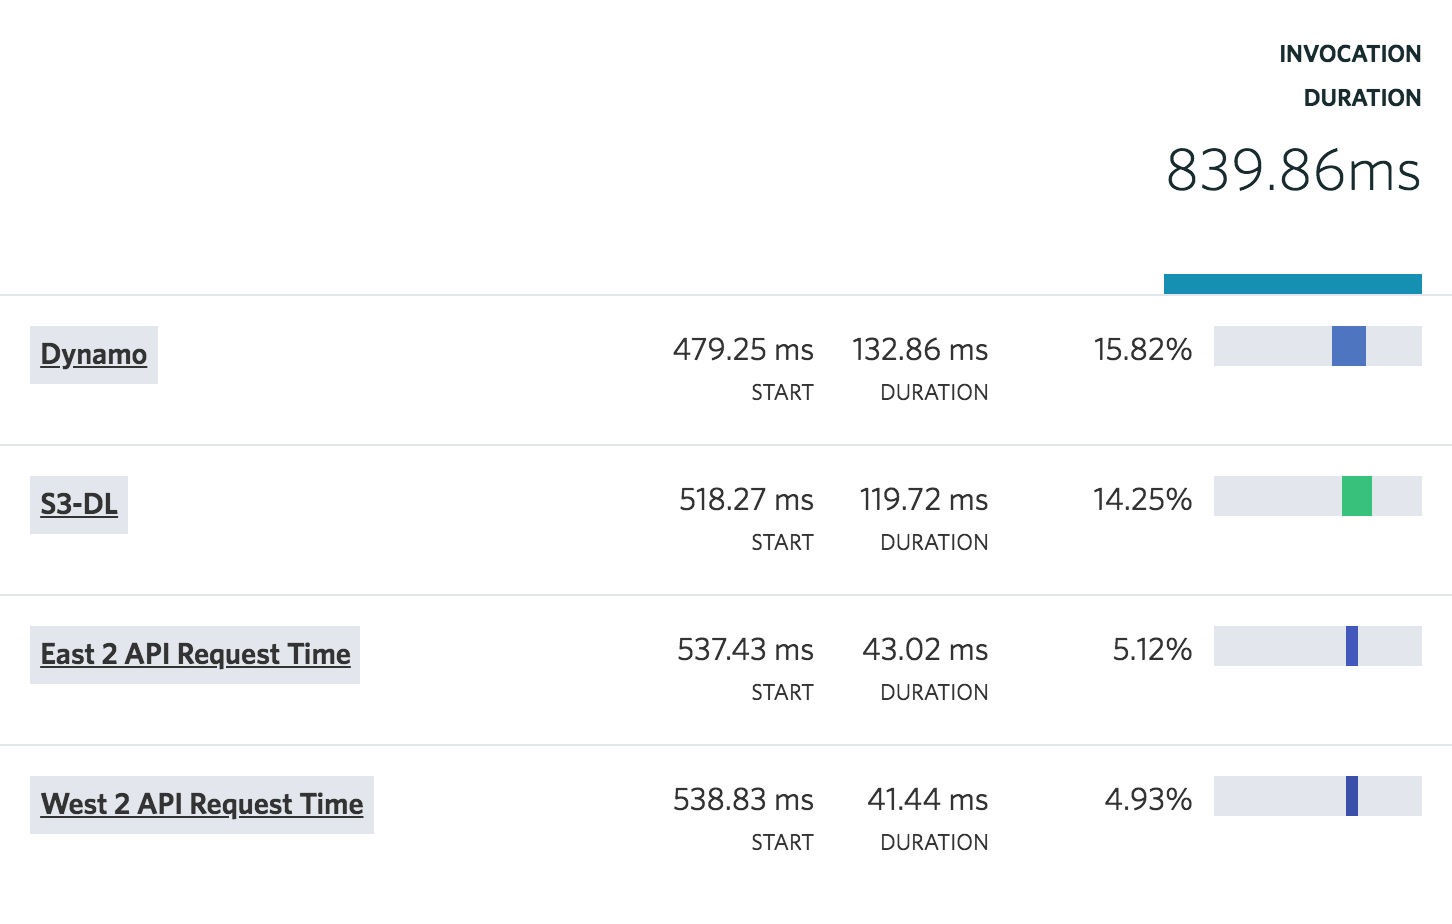
Trying to figure out why a function is running slowly after a new release? Tracing lets you visualize and track the performance of selected calls made from your functions. Taking a look at each call separately allows you to figure exactly which service is slowing down your application.Want to get alerted whenever these calls take longer than they should? We got you covered.
Labels
- Identify invocations to group together in the dashboard.
- View new matching invocations in real time.
- Use custom labels as filters and advanced search rules.
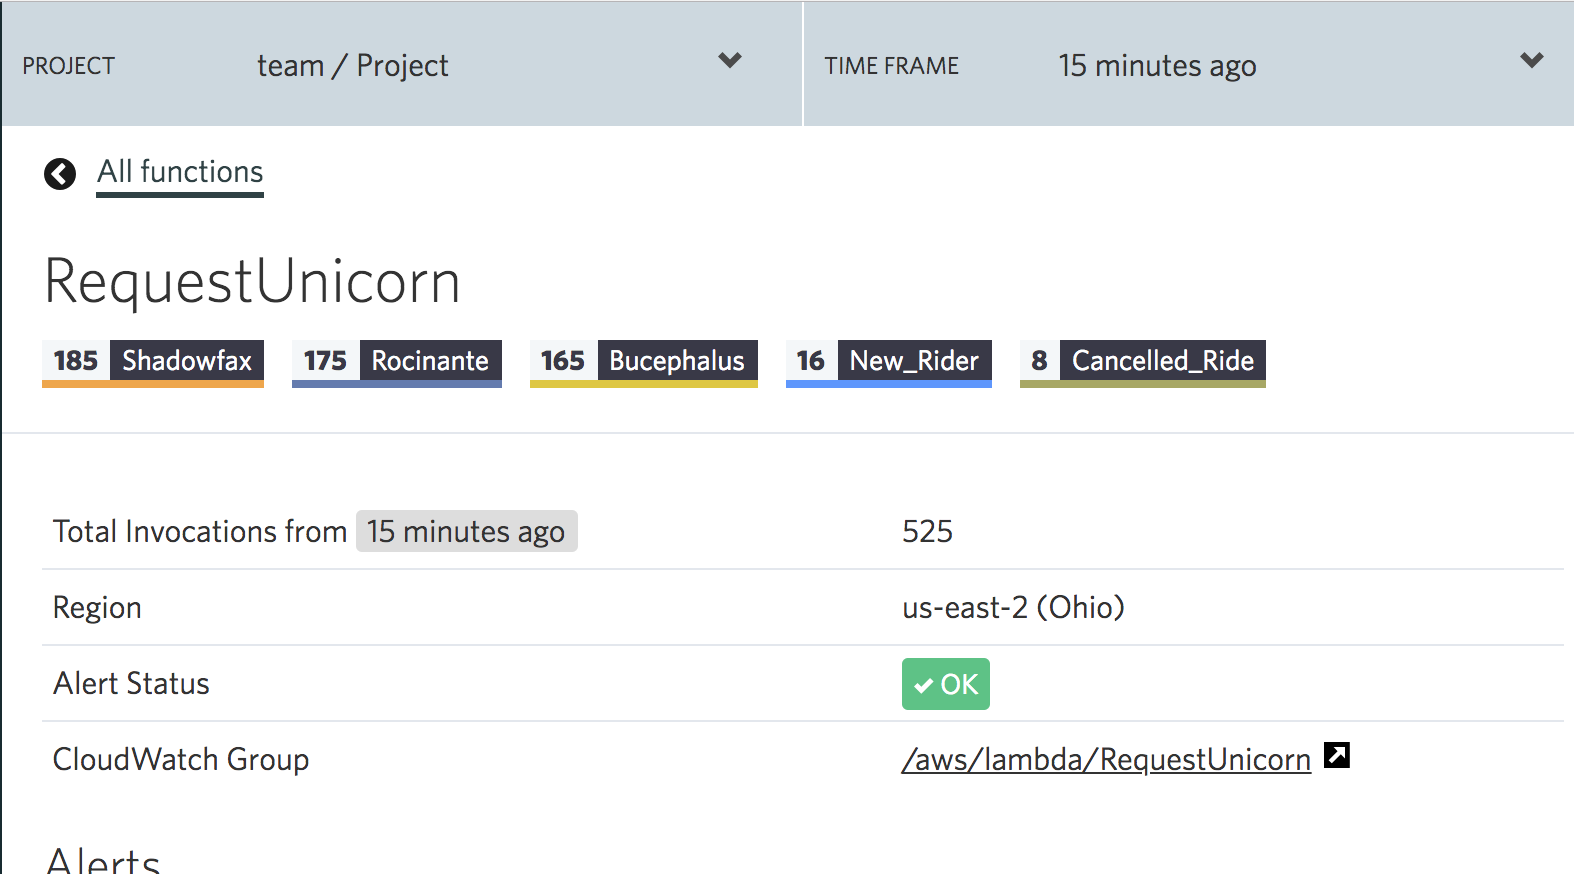
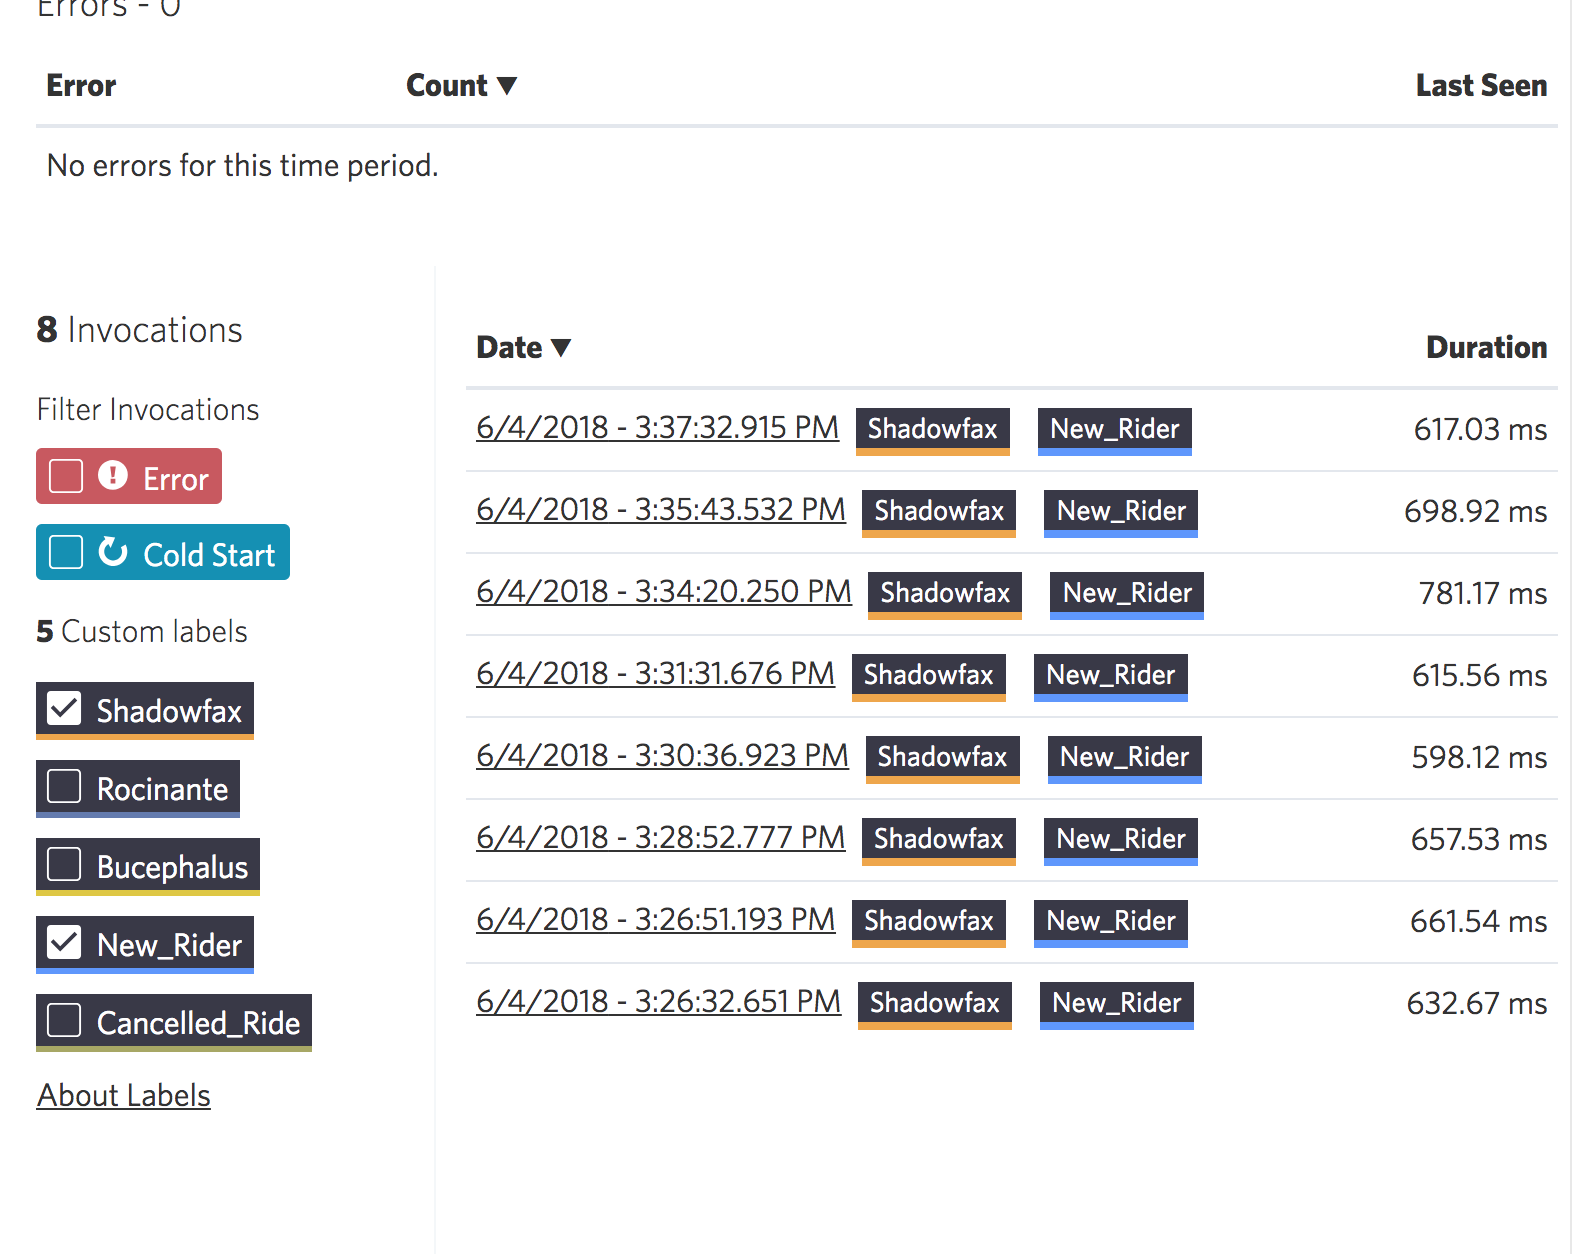
Make serverless observability and debugging crystal clear with labels. Invocation labels give you the power to tag an invocation at runtime and expose it in the dashboard, allowing you to filter and search for any combination of filters within or across functions.
Search
- Dig through mountains of data like a pro to find outliers and events for fast troubleshooting.
- Metrics, custom metrics, and trace data combined give you the ability to see exactly what’s going on in your serverless applications.
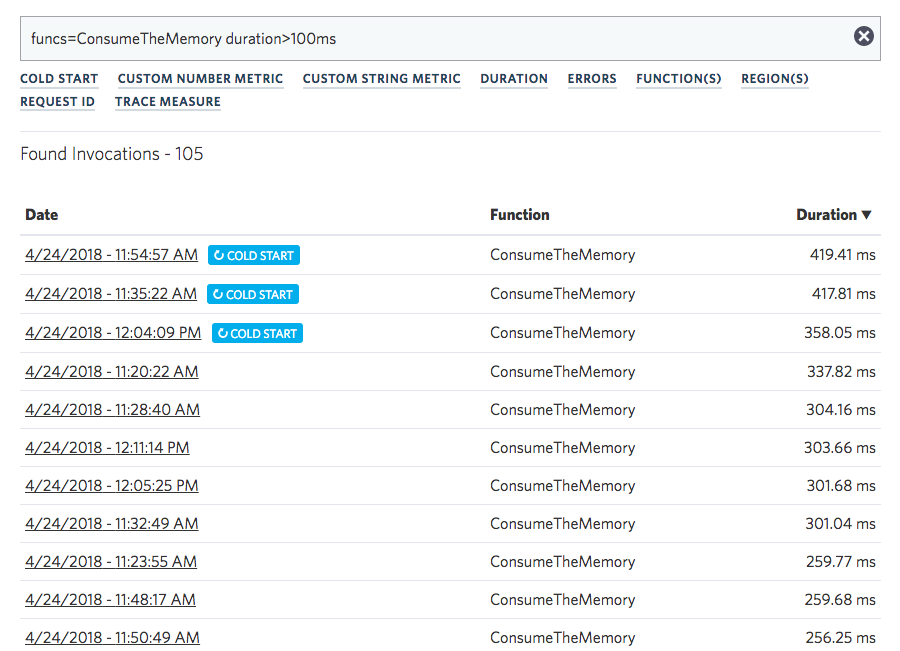
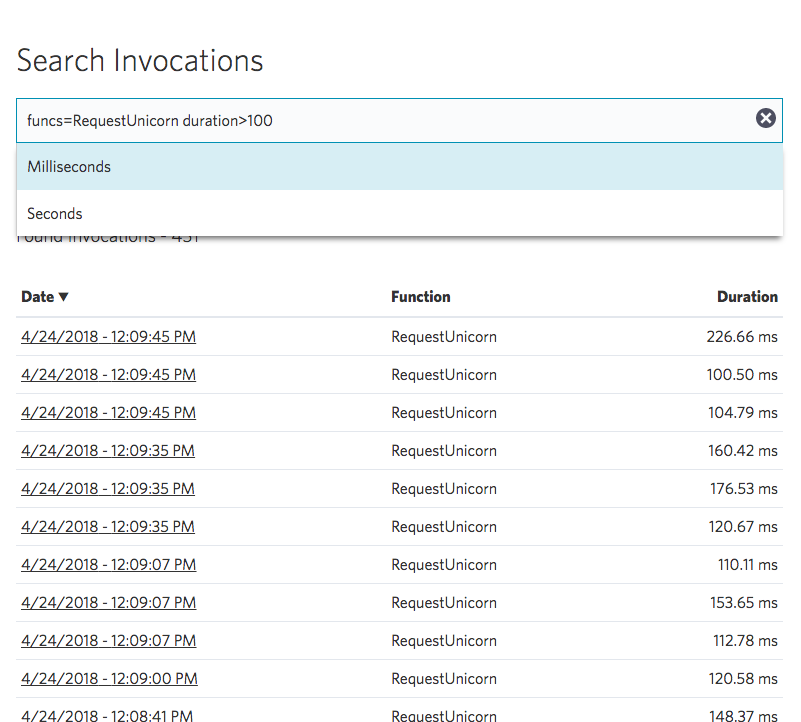
Trying to find the needle in the stack of needles? Serverless applications are awesome, but it can be tricky to find out exactly what’s going on when issues arise. IOpipe lets you dig through mountains metrics and trace data to find the root cause like a pro.
Weekly Email Reports
Every week you can receive a concise, yet detailed report on how your application is performing.. We bubble up the top functions that have changed from week to week, showing you performance improvements or degradation, along with the top errors and alerts.